Performance: The Ultimate Couch Potato Portfolio Guide
Core vs. advanced couch potato
So, how do these portfolios stack up against each other? Here’s the near-term comparison of balanced portfolio models, core versus advanced.
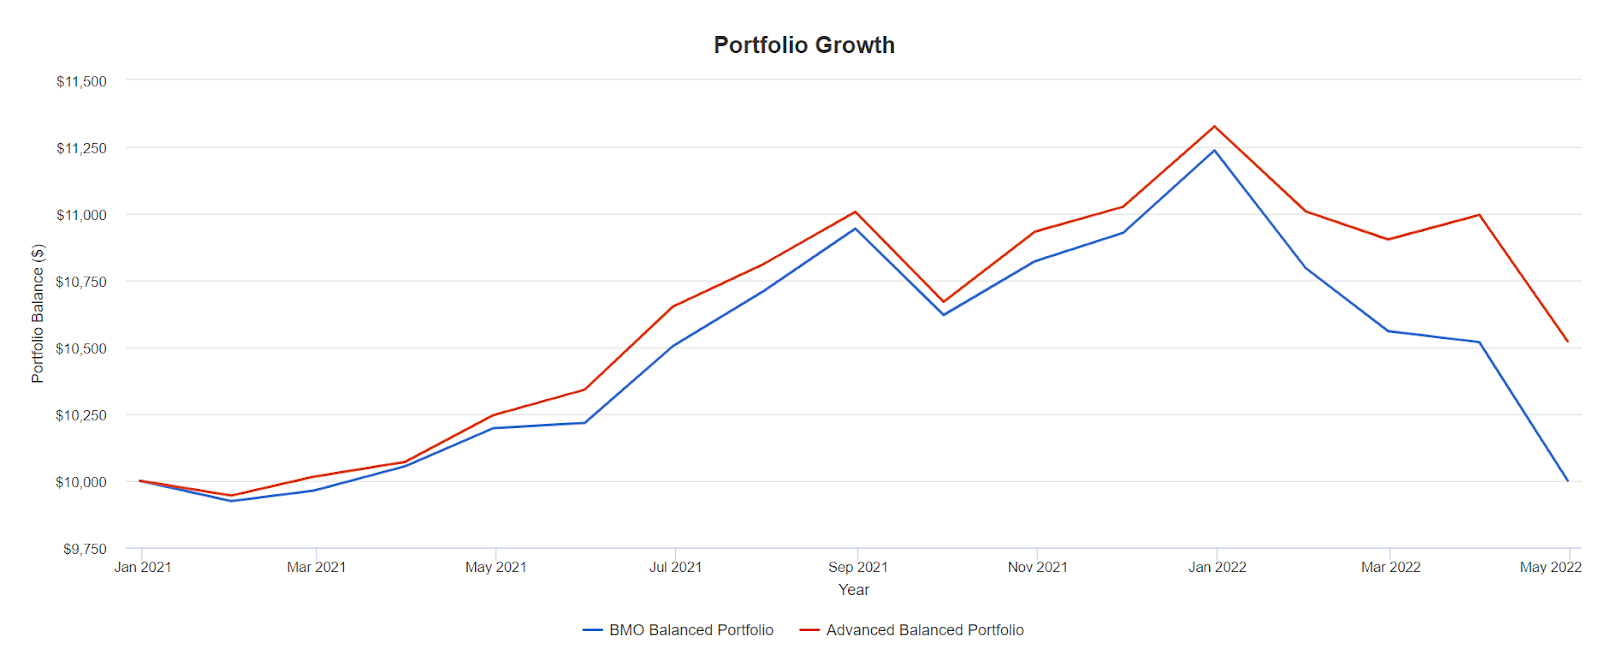
The BMO Balanced model is flat at the beginning of 2021, while the advanced balanced model delivered 5.2% in cumulative return for the period.
If we look back to 2015, we’ll find that the core model outperforms. (I’ve substituted for long-term treasuries to create the chart with an approximation.)
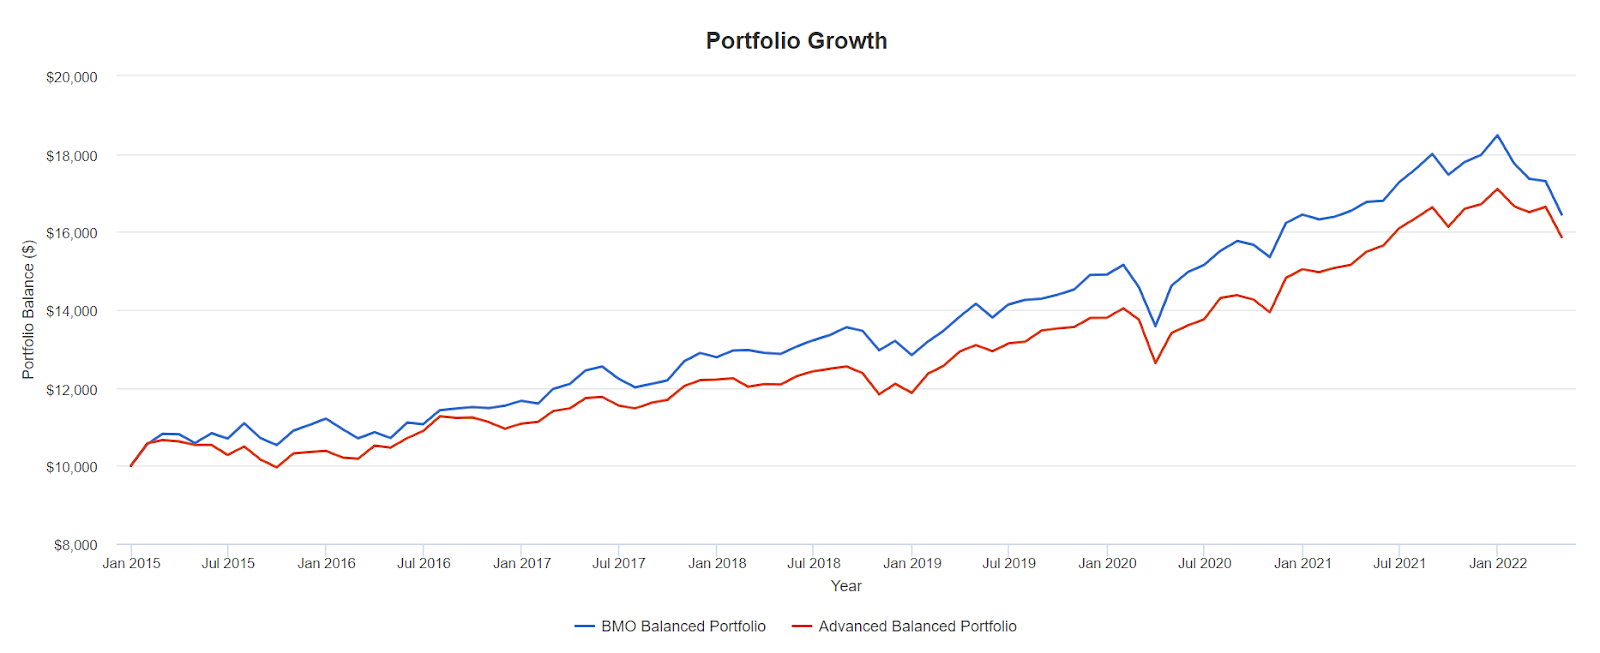
Over the long run, the BMO Balanced portfolio delivered an annual return of 7.0%, versus 6.5% for the advanced model. We would expect the core model to outperform in a disinflationary period, or when inflation is mostly under control. If we remain in an inflationary or stagflationary environment, the advanced couch potato model should greatly outperform the core portfolio.
All that said, there is often very little cost to adding that inflation protection, according to what I see in my research. And in most periods between the 1970s and now, adding gold, commodities and REITs will increase the performance of a balanced portfolio.
See the chart below for how a 60/40 U.S. balanced portfolio looks against a balanced portfolio with 20% bonds and 20% gold. The commodities allocation is not available on Portfolio Visualizer from 1972, so I used gold as the inflation-fighter. Gold is also known as a “safe haven asset,” and it typically performs well when stock markets correct in aggressive fashion.
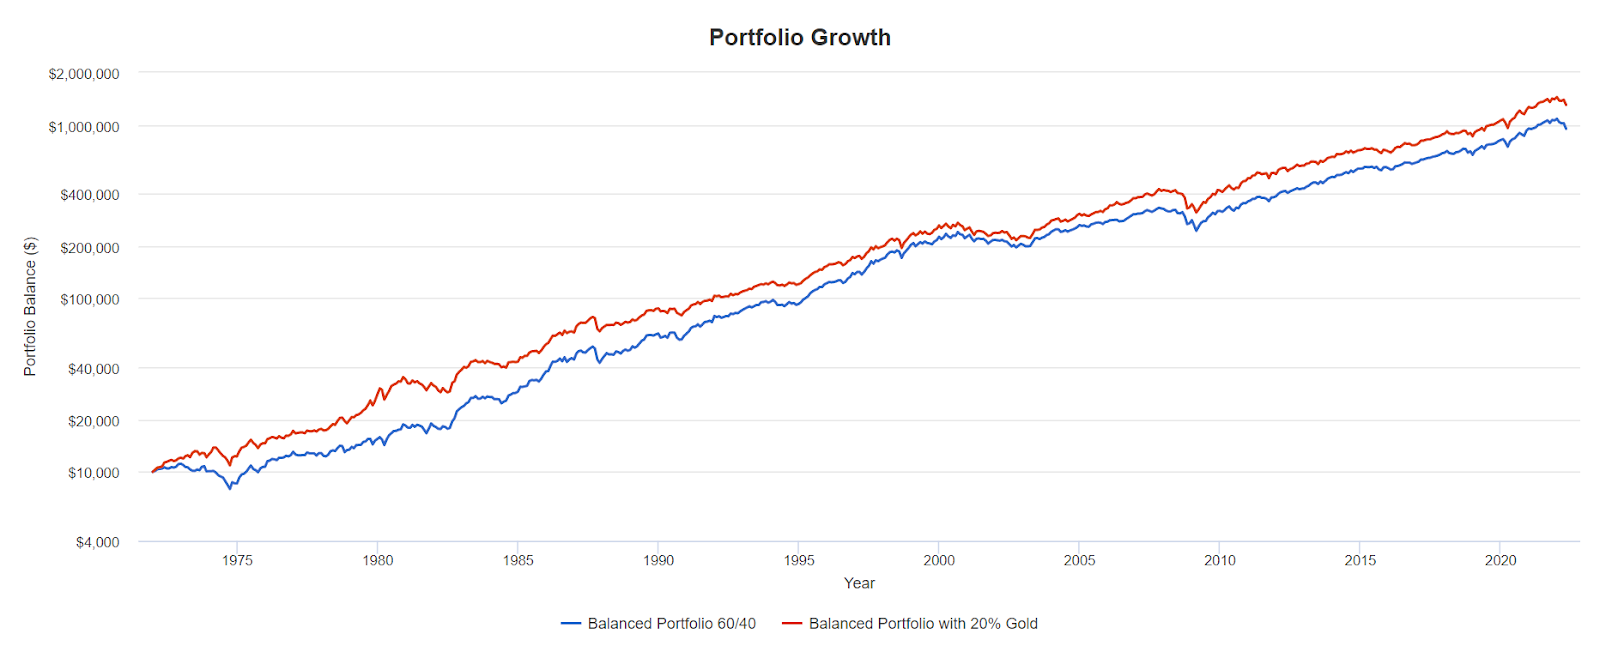
The balanced portfolio with gold outperforms the traditional balanced model by 0.50% annually. In the above chart, the balanced portfolio consists of 60% U.S. stocks and 40% U.S. bonds. The balanced portfolio with gold has 60% U.S. stocks, 20% U.S. bonds and 20% gold.
Once again, whether or not to add gold and commodities is a personal call for the self-directed investor.